In the last post we saw how to spin a http/2 server using embedded jetty. In this post we will see, how to use asynchronous servlet (as well as AIO a.k.a non-blocking IO) and why that is important?
Asynchronous Servlets ≠ Asynchronous IO[1]
The concept of Asynchronous Servlets is often confused with Asynchronous IO or the use of NIO. However, Asynchronous Servlets are not primarily motivated by asynchronous IO, since:- HTTP Requests are mostly small and arrive in a single packet. Servlets rarely block on requests.
- Many responses are small and fit within the server buffers, so servlets often do not block writing responses.
Asynchronous Servlets Use-case
The main use-case for asynchronous servlets is waiting for non-IO events or resources. Many web applications need to wait at some stage during the processing of a HTTP request, for example:- waiting for a resource to be available before processing the request (e.g., thread, JDBC Connection)
- waiting for an application event in an AJAX Comet application (e.g., chat message, price change)
- waiting for a response from a remote service (e.g., RESTful or SOAP call to a web service).
Significantly better scalability and quality of service can be achieved if waiting is done asynchronously. But, how much benefit will we get by off-loading container threads and switching to asynchronous servlets?
Benefits of Asynchronous servlet (RESTful Web Service)
Consider a web application that accesses a remote web service (e.g., SOAP service or RESTful service). Typically a remote web service can take hundreds of milliseconds to produce a response -- eBay's RESTful web service frequently takes 350ms to respond with a list of auctions matching a given keyword -- while only a few 10s of milliseconds of CPU time are needed to locally process a request and generate a response.To handle 1000 requests per second, which each perform a 200ms web service call, a webapp would needs 1000*(200+20)/1000 = 220 threads and 110MB of stack memory. It would also be vulnerable to thread starvation if bursts occurred or the web service became slower.
If handled asynchronously, the web application would not need to hold a thread while waiting for web service response. Even if the asynchronous mechanism cost 10ms (which it doesn't), then this webapp would need 1000*(20+10)/1000 = 30 threads and 15MB of stack memory. This is a 86% reduction in the resources required and 95MB more memory would be available for the application.
Furthermore, if multiple web services request are required, the asynchronous approach allows these to be made in parallel rather than serially, without allocating additional threads.
Hello world
Let's dive into our Helloworld example and see how we can benefit from async servlet. The default limit of Jetty thread pool (number of threads serving user requests) is 250. Without limiting this pool size, we will have to fire more than 250 concurrent requests to measure the impact of async operation in test environment. So, for this experiment, let's limit the server pool thread count to 5 as follows in the server creation code. QueuedThreadPool pool = new QueuedThreadPool(5);
pool.setName("server-pool");
Server server = new Server(pool);
Now let's introduce an artificial delay of 5 seconds in the servlet handling code as follows to mimic some real processing in production.
protected void doGet(HttpServletRequest request, HttpServletResponse response) throws IOException {
    try {
        Thread.sleep(5_000);
        response.setStatus(HttpServletResponse.SC_OK);
        response.setContentType("text/html");
        response.setCharacterEncoding("utf-8");
        response.getWriter().println("<h1>Hello from HelloServlet</h1>");
    } catch (Exception ex) {
        log.error(null, ex);
    }
}
Let's fire 10 requests and measure the response times using the following client code.
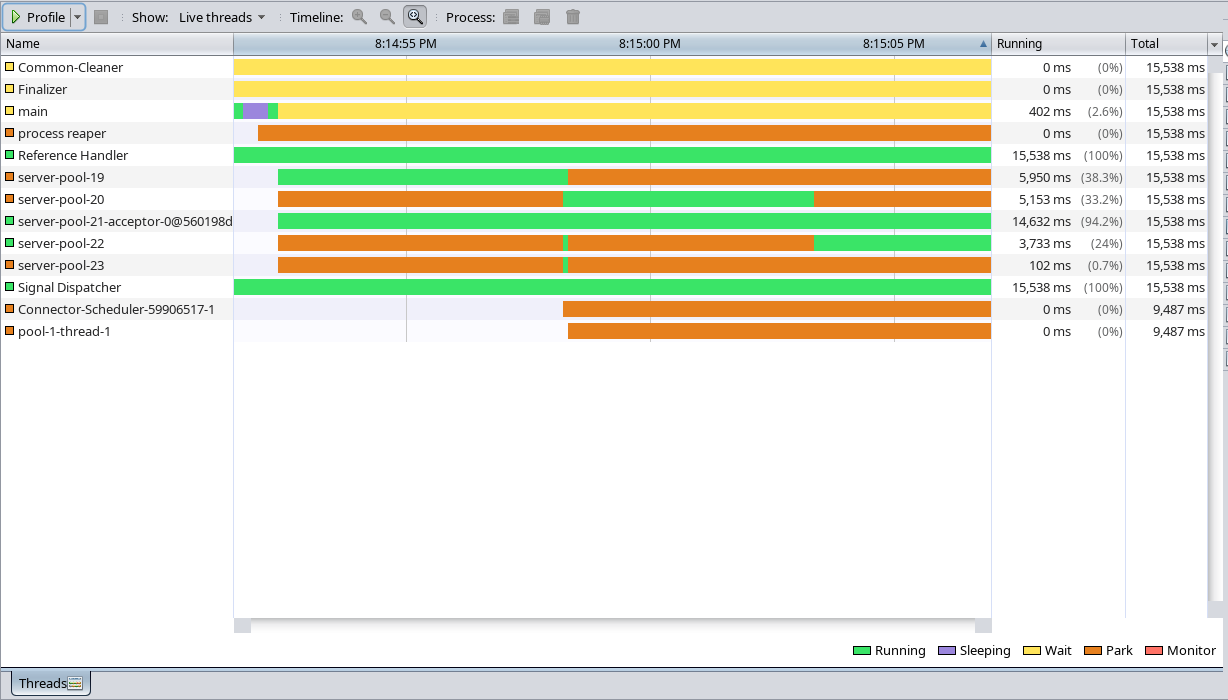
![]()
In this image, you can see that out of 5 threads, 3 are used for internal purpose and 2 (thread 19 and 23) are serving user requests. The purple color indicates the time the threads were in sleeping state. Since we dont have much processing, we can take the purple color as the indication of duration in which a thread is associated with its corresponding request. Let's look at the output.
In most real time scenarios, the thread will be waiting for data from database or from a RESTful service wasting CPU cycle and memory and also increasing the mean response times.
Let's tweak the servlet code a little bit to release the waiting/sleeping thread.
Change the servlet registration code as follows to enable async support in servlet.
Let's look at the thread profiling result.
![]() This image shows that server-pool threads are idle(i.e., in parked state) most of the time and hence it is evident that they are not tied to the lifetime of the request.
This image shows that server-pool threads are idle(i.e., in parked state) most of the time and hence it is evident that they are not tied to the lifetime of the request.
Let's look at the output.
Of course, this example is far from real world scenario. But I believe it gave you an idea of what async servlets is.
You may think that the net effort is same in real world whether we execute in servlet thread or offloading to another thread. You are right. The answer lies in what you do in the offloaded thread. If you are calling a REST service and if your client uses non-blocking IO (a.k.a AIO) then instead of using one thread per request you can handle thousands of requests using a very small number of threads -- as low as 5.
For more information on how to use AIO REST client please refer to this post.
You can get source for this project from here. You can directly open the project in NetBeans and run or run it from command line using maven.
    HttpClient httpClient = new HttpClient();
    httpClient.setConnectTimeout(60_000);
    httpClient.setIdleTimeout(60_000);
    httpClient.start();
    ExecutorService executor = Executors.newCachedThreadPool();
    for (int i = 0; i < 10; i++) {
        executor.submit(() -> {
            long t1 = System.currentTimeMillis();
            Request req = httpClient.newRequest("http://localhost:8080/hello-servlet");
            req.idleTimeout(1, TimeUnit.MINUTES);
            ContentResponse response = req.send();
            long t2 = System.currentTimeMillis();
            log.info("response time:{} ms", t2 - t1);
            return true;
        });
    }
    executor.shutdown();
    executor.awaitTermination(2, TimeUnit.MINUTES);
    httpClient.stop();

In this image, you can see that out of 5 threads, 3 are used for internal purpose and 2 (thread 19 and 23) are serving user requests. The purple color indicates the time the threads were in sleeping state. Since we dont have much processing, we can take the purple color as the indication of duration in which a thread is associated with its corresponding request. Let's look at the output.
[pool-1-thread-8 ] INFO com.pb.jetty.http2.client.Client - response time:5254 ms
[pool-1-thread-7 ] INFO com.pb.jetty.http2.client.Client - response time:5254 ms
[pool-1-thread-6 ] INFO com.pb.jetty.http2.client.Client - response time:10238 ms
[pool-1-thread-10] INFO com.pb.jetty.http2.client.Client - response time:10242 ms
[pool-1-thread-1 ] INFO com.pb.jetty.http2.client.Client - response time:15247 ms
[pool-1-thread-5 ] INFO com.pb.jetty.http2.client.Client - response time:15243 ms
[pool-1-thread-2 ] INFO com.pb.jetty.http2.client.Client - response time:20252 ms
[pool-1-thread-9 ] INFO com.pb.jetty.http2.client.Client - response time:20247 ms
[pool-1-thread-4 ] INFO com.pb.jetty.http2.client.Client - response time:25245 ms
[pool-1-thread-3 ] INFO com.pb.jetty.http2.client.Client - response time:25251 ms
In most real time scenarios, the thread will be waiting for data from database or from a RESTful service wasting CPU cycle and memory and also increasing the mean response times.
Let's tweak the servlet code a little bit to release the waiting/sleeping thread.
Change the servlet registration code as follows to enable async support in servlet.
    ServletHolder asyncHolder = context.addServlet(HelloServlet.class, "/hello-servlet");
    asyncHolder.setAsyncSupported(true);
    private final ScheduledExecutorService executor = Executors.newSingleThreadScheduledExecutor();

    @Override
    protected void doGet(HttpServletRequest request, HttpServletResponse response) throws IOException {
        final AsyncContext asyncContext = request.startAsync();
        executor.schedule(() -> {
            try {
                response.setStatus(HttpServletResponse.SC_OK);
                response.setContentType("text/html");
                response.setCharacterEncoding("utf-8");
                response.getWriter().println("<h1>Hello from HelloServlet</h1>");
            } catch (Exception ex) {
                log.error(null, ex);
            }
            asyncContext.complete();
        }, 5, TimeUnit.SECONDS);
    }
Let's look at the thread profiling result.
Let's look at the output.
[pool-1-thread-9 ] INFO com.pb.jetty.http2.client.Client - response time:5236 ms
[pool-1-thread-10] INFO com.pb.jetty.http2.client.Client - response time:5236 ms
[pool-1-thread-2 ] INFO com.pb.jetty.http2.client.Client - response time:5239 ms
[pool-1-thread-8 ] INFO com.pb.jetty.http2.client.Client - response time:5238 ms
[pool-1-thread-6 ] INFO com.pb.jetty.http2.client.Client - response time:5239 ms
[pool-1-thread-4 ] INFO com.pb.jetty.http2.client.Client - response time:5240 ms
[pool-1-thread-5 ] INFO com.pb.jetty.http2.client.Client - response time:5240 ms
[pool-1-thread-3 ] INFO com.pb.jetty.http2.client.Client - response time:5240 ms
[pool-1-thread-7 ] INFO com.pb.jetty.http2.client.Client - response time:5240 ms
[pool-1-thread-1 ] INFO com.pb.jetty.http2.client.Client - response time:5244 ms Of course, this example is far from real world scenario. But I believe it gave you an idea of what async servlets is.
You may think that the net effort is same in real world whether we execute in servlet thread or offloading to another thread. You are right. The answer lies in what you do in the offloaded thread. If you are calling a REST service and if your client uses non-blocking IO (a.k.a AIO) then instead of using one thread per request you can handle thousands of requests using a very small number of threads -- as low as 5.
For more information on how to use AIO REST client please refer to this post.
You can get source for this project from here. You can directly open the project in NetBeans and run or run it from command line using maven.

AIO (non-blocking) Servlets
But what about AIO servlet? It is little complicated to picture the use of AIO in servlets; it is better explained in the AIO REST client post. But for the record, Jetty already uses AIO in servlets. Here is a little scenario that can help you understand where AIO is used in Jetty.
Thread per connection
The traditional IO model of Java associated a thread with every TCP/IP connection. If you have a few very active threads, this model can scale to a very high number of requests per second.
However, the traffic profile typical of many web applications is many persistent HTTP connections that are mostly idle while users read pages or search for the next link to click. With such profiles, the thread-per-connection model can have problems scaling to the thousands of threads required to support thousands of users on large scale deployments.
However, the traffic profile typical of many web applications is many persistent HTTP connections that are mostly idle while users read pages or search for the next link to click. With such profiles, the thread-per-connection model can have problems scaling to the thousands of threads required to support thousands of users on large scale deployments.


